RE/MAX National Housing Report Q3 2019
SALES INCREASE AS PRICES SHOW MODERATE GROWTH
The South African property market has been experiencing a lull since early last year, with national house price growth struggling to outpace inflation. However, according to Adrian Goslett, Regional Director and CEO of RE/MAX of Southern Africa, the results of the RE/MAX National Housing Report for Q3 2019 reveal that we might be on our way to breaking out of this lull within the foreseeable future.
“The first sign of recovery is increased activity within the market. Fewer transfers would mean lower demand and lower house price growth. Luckily, according to Lightstone Property data, a total of 49,637 bond registrations were recorded at the Deeds Office over the period of July to September 2019, totalling an amount of R53,896,783,000. This translates into a 10% increase in the amount of bonds registered since Q2 2019 and an 24% increase since Q3 2018. The number of transfers (both bonded and unbonded) recorded at the Deeds Office between July and September also increased by 17% from last year, and by 8% from Q2 to 70,717 transfers in the third quarter of 2019. This bodes well for overall market recovery,” Goslett explains.
House price growth compared to sales volumes
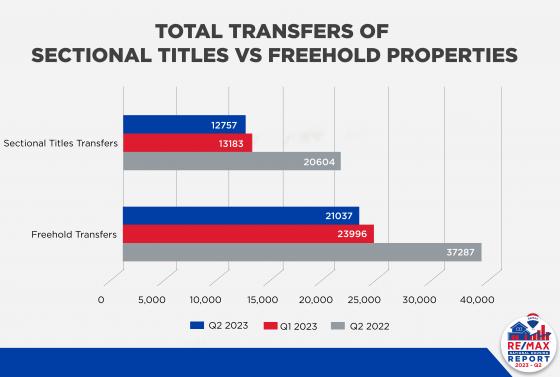
Of the 70,717 transfers, a total of 35,495 freehold properties and 17,850 sectional title units were sold countrywide (*these figures exclude estates, farms, and land only transfers). YoY, the number of freehold properties sold increased by 17% while sectional titles saw a 23% increase when compared to Q3 2018.
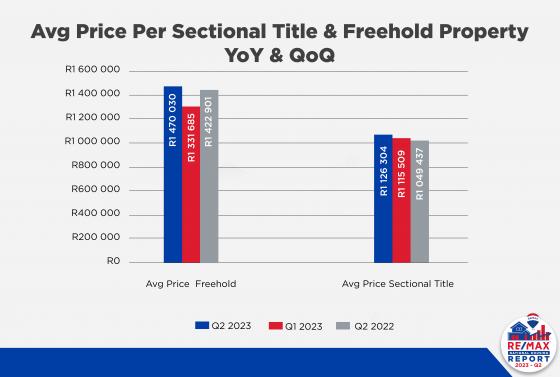
While more sectional titles than freehold properties were sold, the national median price of a sectional title* grew by just 0.3% to R1,023,549 from the R1,020,330 in Q3 2018, and dropped by 1% since last quarter. On the other hand, the current national median price of a freehold home* has grown to R1,116,234 which is a 6.5% increase on the median asking price for Q3 2018 (R1,004,733). However, when compared to last quarter, the median asking price dropped by 3%.
“These results could be interpreted in a variety of ways, but the key takeaway for me is that sales are increasing, and prices are edging up slowly. However, our own sales results reflected a 16% increase YoY in the average active RE/MAX listing price that amounted to R3,005,504.70 for Q3 2019,” says Goslett.

Breakdown of sales per price bracket
Homes below R400,000 continue to account for the largest portion of sales, at 31% of the total transfers. Year-on-year, this price segment saw a 15% increase (or 2,800 more transfers) on the figures for Q3 2018. Following close behind are homes between R800,000 and R1,5 million at 25% of the total transfers. Year-on-year, this price segment saw a 20% increase (or 2,904 more transfers) on the figures for Q3 2018. This is followed by homes between R400,000-R800,000 at 24% of the total transfers. Year-on-year, this price segment saw an 18% increase (or 2,636 more transfers) on the figures for Q3 2018. Homes between R1,5 million to R3 million accounted for 15% of transfers and grew by 21% (or 1,877 more) YoY in number of transfers. Making up the smallest portion of total transfers are properties priced above R3 million. At just 5%* of the total transfers, this segment grew by 7% (or 231 more) YoY in the number of transfers.
“While the amount of transfers for this period increased, there weren’t any significant shifts in the proportion of sales per price bracket as a percentage of the total transfers, with all price segments either growing or shrinking by less than 1% in this regard. This points to a market that is performing much the same as usual. Similarly, the average bond amount granted during this period dropped by 1% since last quarter to R1,086,000* – which is the exact same figure for Q3 2018,” Goslett explains.

Province Performance Breakdown
When it comes to a provincial breakdown, Durban North catapulted itself to the top of the list of the top five searched suburbs nationally on remax.co.za during Q3 2019. The rest of the list was dominated by suburbs within Gauteng: Moreletepark placed second, followed closely by Morningside, then Bryanston and lastly Randpark Ridge.
According to Private Property statistics, the Western Cape still has the highest national median asking price at R2,495,000 and the North West has the lowest at R1,175,000. Overall, the Free State reflected the highest quarter-on-quarter growth, with the median asking price increasing by 7% on last quarter to R1,177,950. Interestingly, the North West came in second with 5% growth on last quarter’s amount. Conversely, the Northern Cape reflected the largest drop in median asking price with a 0.3% decrease on last quarter’s figures to R1,585,000. The Western Cape followed close behind at a 0.2% decrease on last quarter’s figures.
“Overall, the third quarter performed well and saw an increase in activity in terms of the number of transactions that took place. I remain hopeful that the property market will continue to strengthen over time,” Goslett concludes.
For more information, get in touch with a trusted real estate advisor from the largest real estate brand in Southern Africa by visiting www.remax.co.za.
Send to a Friend